General Interest
Back to Top
|
 |
|
Mapping the Lives
|
Social studies |
|
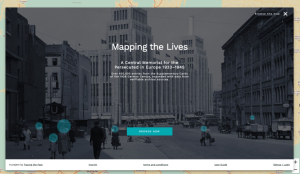
Historians, sociologists, and those interested in tracing the history of the Holocaust may benefit from Mapping the Lives, a platform that serves as "a central memorial for the persecuted in Europe [from] 1933-1945." Through interactive street maps that memorialize victims of the Nazi Regime's persecution, the resource goes beyond traditional "memorial book[s]" to reclaim space for the lives that were lost. In doing so, they show a deeper picture of the neighborhoods--down to a street address--impacted by the Holocaust. The creators recommend that users read the Mapping the Lives User Guide (accessible by clicking the box in the top left corner and selecting User Guide) before diving into the database. This guide defines some key terms, explains how best to navigate the site, and links to a page on the data source (the 1939 German Minority Census) that also contains a 2014 TED talk from Roderick Miller introducing Mapping the Lives. On the Home page visitors can navigate the map itself, beginning at a macro-level to examine the country-wide impact of the Holocaust, or zooming in to understand how this tragedy impacted individual cities and neighborhoods. In addition to scrolling the map, readers can search by name, street, and city by entering information into the Search box at the top left, or conduct an Advanced Search (linked at the bottom of the Search box). Mapping the Lives is an extension of Tracing the Past, a non-profit organization seeking to bring the "far-removed past [of the Holocaust] more clearly into the residents of Europe's sense of daily reality." The resource is available in both English and German. [EMB] |
|


|
|
 |
|
Going Critical
|
Science |
|
What do infectious diseases and internet memes have in common? They both spread through networks, as Kevin Simler (computer scientist, engineer, and self-proclaimed "restless millennial") reminds us in "Going Critical." This interactive essay, published by Simler in 2019 on his online essay database Melting Asphalt, explores how "networks rule our world." "Going Critical" invites readers to play with "transmission rates" and models to better understand how these networks work, focusing on the "the way things move and spread, somewhat chaotically, across a network." The essay is broken down by topic, such as Degree and Cities and Network Density. Each section features visual and interactive tools and a discussion of the thematic topic. This structure helps users digest the material - whether phrases like "spontaneous activation" and "supercritical networks" are new to your vocabulary, or you're a seasoned pro in the network arena. If you enjoy this piece, you may want to check out the rest of the site, which features other essays such as "A Natural History of Beauty" and "Here Be Sermons." [EMB] |
|


|
|
 |
|
Cheese Science Toolkit
|
Science |
|
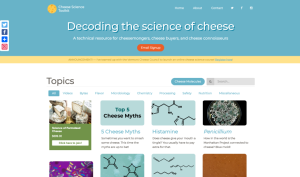
If you're curious about cheddar, you've gouda check out Cheese Science Toolkit. The website is the passion project of Pat Polowsky, who is both a food scientist and a web front end developer, the perfect skill set for creating this web-based science guidebook about cheese. Polowsky says the audience for the Cheese Science Toolkit is anyone who interacts with cheese after it is made, including cheese sellers, buyers, eaters, and "all-around curd nerds". The main content on the site is a series of posts on all topics cheese. Dear to those of us in Wisconsin is the short science byte post entitled "Squeak" that answers the questions, "Why do cheese curds squeak? And why do they lose their squeak?" Another post provides a handy cheese classification chart, categorizing cheeses into unripened, soft cheese (e.g. ricotta, chevre, or fresh mozzarella) and ripened, harder cheese (e.g. Cheddar, Limberger, or Parmesan). For those looking for even more cheese education, an announcement on the website indicates that Polowsky has partnered with the Vermont Cheese Council to offer an online course, The Science of Farmstead Cheese. The course is fee-based, which gives students access to all course materials for one year, but a free preview is available to help prospective students decide if they'd like to sign up. [DS] |
|


|
|
 |
|
The "Oka Crisis": A Digital Atlas of the 1990 Events at Kanehsata:ke
|
Social studies |
|
The "Oka Crisis": A Digital Atlas of the 1990 Events at Kanehsata:ke encapsulates years of protest against colonialism, culminating in "policy change and Indigenous visibility." The resource uses a map, broken into six chapters, with pinned locations, pictures, and information, that offers educators a "user-friendly, interactive resource to supplement their current curriculum and counter the collective 'forgetting' and unfounded stereotypes and narratives that surround the Kanien'keha:ka resistance and uprising." At the bottom of the main page, readers will find information on how to use the map, as well as a variety of additional related resources to explore. After reviewing how to use the map, instructors can check out the suggested lesson plan, which is broken into three parts (downloadable as PDFs), each meant to last approximately 50-minutes. Part One breaks down an instructor-led simulation meant to introduce students to "the context, events, and impacts of the 1990 Kanehsata:ke's resistance." Part Two asks students to work in groups to reflect on what they've learned and explore a specific chapter of the map in their group. Part Three puts the students in the driver's seat, asking them to share out to their classmates what their group learned. The "Oka Crisis": A Digital Atlas of the 1990 Events at Kanehsata:ke is a project of the University of Victoria's Anthropology Department Ethnographic Mapping Lab. Readers who enjoy this resource may want to explore other archived content from the Lab. [EMB] |
|


|
|
 |
|


