The Scout Report -- Volume 26, Number 21

The Scout Report -- Volume 26, Number 21
June 5, 2020
Volume 26, Number 21

General Interest

Theme: Sports Statistics

Tech Tools

Revisited

If you would like to make a tax-deductible contribution to support The Scout Report and the work of Internet Scout, please visit our donation page.

General Interest

Back to Top
Inside Journal
Language Arts

From "hope lost...[to] hope found again," Inside Journal offers a safe space to share the spectrum of emotions experienced by people around the world as we navigate COVID-19. The project recognizes that journaling can help process and preserve these complex emotions and invites contributors and readers to "share feelings, learn from one another, and put our creative minds to work." Those interested in contributing can click the "Write an Entry" button, which leads to a Google form with journal prompts. There are two prompt options, one for first-time contributors and another for those who have previously contributed. Those who prefer reading posts to contributing are welcome to browse the "Recent Contributors" section, which contains submissions from all corners of the globe. Each post offers a unique perspective on "the moment that coronavirus got real for you." In addition to reading the posts, visitors will want to watch the project's trailer, a touching four-minute film that explores how people are coping during the global pandemic. Readers can also find Inside Journal's content on Instagram (@insidejournal). [EMB]

Comment on or rate this resource

Gathering Places
Religion

Milwaukee gets its name from the Algonquin word for "gathering place." Gathering Places, an ongoing project, archives and celebrates the role of places of worship play in building Milwaukee's identity and community. The project notes that, "as sites where people regularly gather for worship and fellowship, the city's churches, synagogues, mosques, and temples have helped make the city what it is today." The project documents Milwaukee's religious history through an interactive map and timeline. Users can scroll through the timeline to witness the evolution of Milwaukee's "religious landscape" from 1840 to present. Along the way, markers open descriptions of key periods and places. The project also archives materials that add to its rich documentation of Milwaukee's religious evolution. On the Items page, users can explore more than 100 documents and photographs, sortable by title, creator, or date. On the Places page, readers will find 16 places of worship listed. Clicking on a place reveals the items associated with it, along with a brief description. The Public History program at the University of Milwaukee created Gathering Places with support from the Wisconsin Humanities Council. [EMB]

Comment on or rate this resource

The Splendid Table
Social studies

The Splendid Table got its start as a call-in show on Minnesota Public Radio in the 1990s. Today the show is hosted by food writer Francis Lam, who took over from Lynne Rossetto Kasper in 2018. Recent episodes are featured on the front page of the website. For a full archive dating back to 1999 check out the Episodes page. Weekly installments cover topics such as safe practices for buying and preparing food during the COVID-19 pandemic (see "Episode 704: How to Shop and Eat Safely Now") and the finer points of alcohol (see "Episode 701: The Culture of Drinking"). The site also has a Stories section with hundreds of interviews and culinary insights, as well as some culinary lessons in video format. And, of course there is a searchable and browsable database of thousands of recipes. At the top of the Recipes page, users can filter by category, such as Cheap Eats and Comfort Food. Visitors can also sign up for an email Newsletter, promising "an easy weeknight recipe and more, delivered once a week." Episodes are available to stream at the link above, as well as on most major podcast platforms. [DS]

Comment on or rate this resource

Science Sparks
Science

Created by educator Emma Vanstone and blogger Kerry Farrow, Science Sparks! is a blog that lives up to its motto of "making science fun for kids." The site curates a variety of at-home activities that are both delightful and informative. Activities are categorized by age level (Early Years Science and Primary Science), as well as some more general themes (Science Projects, STEM Challenges, and Holiday Science). Each broader topic is further divided into subtopics, helping readers find just what they are looking for. For example, those feeling festive may want to venture to the Holiday Science section. Here, readers will discover spooky potion and slime recipes to celebrate Halloween and science-themed crafts that make for great Christmas gifts. LEGO enthusiasts will want to pay a visit to the LEGO Science Experiments section, a subtopic of Primary Science with more than a dozen posts suggesting ways to combine LEGOS and learning. At the very top of the website, readers will find a variety of other resources: science fair project ideas, experiments, and much more. Educators may be particularly interested in the Worksheets page, also linked at the top of the site. [EMB]

Comment on or rate this resource

Italian Paleography
Language Arts

Launched in July 2019, Italian Paleography catalogs more than 100 Italian papers and manuscripts from the 14th to 18th centuries, presented alongside "tools for deciphering them and learning about their social, cultural, and institutional settings." Paleography is a discipline concerned with studying "histories of handwriting," across various mediums, in context with the relationship between the physical presentation and content of writing. Those less familiar with the field may want to begin on the Home page, where they will find introductory information on the history of paleography and tips for evaluating scripts and a link to a short video describing how to navigate the site (found in the top right corner under Get Started). From there, readers can view and filter the project's documents on the Manuscripts page. In addition to a summary and information on the document's subject matter, most records include links to a brief background essay in English and a transcription of the manuscript in Italian. The site also includes several other resources to aid your understanding and experience. The Handbook page offers insights on the history of Italian vernacular and manuscripts. The Appendix and Resources menus house general information on the project and the study of paleography, including a beginner's guide (under New to Paleography) and Glossary. Educators should check back soon for teaching materials that are currently in the works. The project is a collaboration between The Newberry, University of Toronto Libraries, and St. Louis University, with editors and contributors from around the world and support from The Andrew W. Mellon Foundation. All of the content is available under a Creative Commons license. [EMB]

Comment on or rate this resource

Theme: Sports Statistics

Back to Top
The Rise of Hyphenated Last Names in Pro Sports
Social studies

You may have the jersey of a favorite athlete hanging in their closet, but have you ever thought about the significance of the name on the back? Jan Diehm, a self-proclaimed sports enthusiast and writer for The Pudding, has. "The Rise of Hyphenated Last Names in Sports" uses data from various sports reference sites to track the frequency of hyphenated last names in several different leagues (including the WNBA, NBA, and NHL) from the 1950s through the 2010s. The findings are creatively cataloged in an interactive chart that allows readers to select a sports league (using the dropdown bar on the left-hand side) and decade (using the sliding bar on the right-hand side). From there, the chart lists all the applicable players' jersey names, highlighting hyphenated names in yellow. For example, a search for NBA jerseys in the 1980s reveals only 1 of the 628 players used a hyphenated last name (that player is the legendary Kareem Abdul-Jabbar). Nonetheless, "double-barrelled last names," are on the rise, and in the 2010s, 17 out of 782 NBA players chose hyphenated last names. In addition to colorful charts summarizing research findings, the piece shares some stories and illustrations (drawn by Arthur Mount). For example, Herb Mul-Key, the first NFL player to hyphenate his last name, did so because he was teased about his given "Mulkey," while football player BenJarvus Green-Ellis's hyphenation is an ode to his parents (combining their surnames). [EMB]

Comment on or rate this resource

Sports Analytics for Students
Mathematics

Who would have thought strike zones and statistics make the perfect pair? Inspired by a sports analytics conference, University School of Nashville educator Joel Bezaire is making his case for connections between math and sports organizations with his aptly titled curriculum "Sports Analytics For Students." Math educators in search of a fun way to wrap-up the school year and caregivers looking for ways to keep their teenagers academically engaged during the summer months will find this nearly 100-page packet provides plenty of options to do just that. The packet is freely downloadable in PDF form and contains lesson plans, worksheets, and activities, which are categorized by topic into six chapters and four appendices. Many activities use specific sports teams as a launching point for a statistics lesson, and pop-culture references are sprinkled throughout, adding to the materials' engaging tone. The curriculum was created in 2018 and is geared towards middle and high school students. Though designed as a week-long "summer camp," Bezaire notes that the materials can easily be converted into individual lesson plans. Readers who enjoy this work may also want to check out the rest of Bezaire's blog dedicated to pre-algebra resources. [EMB]

Comment on or rate this resource

Hot Takedown
Mathematics

Produced by news outlet FiveThirtyEight, Hot Takedown is a podcast "where the hot takes of the sports world meet the numbers that prove them right or tear them down." While the show caters to sports enthusiasts, its content and tone invite all listeners to learn and laugh. The show is co-hosted by Sara Ziegler (FiveThirtyEight's sports editor), Neil Paine (a senior writer), and Geoff Foster (former sports editor). Together, the witty trio examines sports teams, players, and topics through a statistical lens, offering insights on everything from NFL Draft Day (see the April 28, 2020 episode) to coping with a basketball-less spring (see the March 31, 2020 episode). FiveThirtyEight first introduced the podcast in 2015, though it took a hiatus in 2018. In 2019, the show was "reborn," releasing new hour-long episodes every week. You can find these episodes, along with show notes and some additional resources referenced in each episode, at the link above. The podcast is also available on popular streaming sites such as Spotify and Apple Podcasts. [EMB]

Comment on or rate this resource

Harvard Sports Analysis Collective
Mathematics

Launched in 2009, the Harvard College Sports Analysis Collective's (HSAC) blog is an extension of the student-run organization that was started three years prior. HSAC provides a space for "quantitative analysis of sports strategy and management," and the blog (written by Harvard University students and faculty) builds on this mission. Under the Topics tab, visitors can choose a sport or subject that suits their interests (such as MLB Baseball or Business). Readers with a more general interest may want to scroll through the homepage, where posts are featured by recency. For example, a recent piece, "HSAC'S 2020 NFL Mock Draft" (written by a group of contributors, including the organization's Co-Presidents Ella Papanek and Danny Blumenthal), discussed the group's predictions for the April 2020 event. Blog posts have gained traction far beyond Harvard's campus. In fact, some posts have been featured by national news outlets, including the Wall Street Journal and Yahoo! Sports. The Publications page catalogs all of these features, broken down by Papers and Articles and Videos. In addition to the blog's wealth of information, readers looking for more content relating to sports statistics and analysis are in luck. The Resources page links to several other databases, academic journals, and websites that may be of interest. [EMB]

Comment on or rate this resource

Tottenham vs Man United, Premier League 2018-19
Mathematics

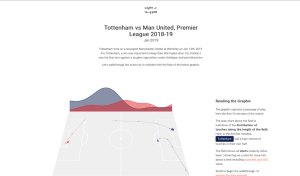
Some games are so legendary sports fans wish to relive them for years to come. "Tottenham vs Man United, Premier League 2018-19," allows soccer fans to do just that, with a statistical twist. The data visualization project memorializes the January 13, 2019 game between Tottenham and Manchester United soccer clubs with an in-depth analysis of each team's plays, shot attempts, and goals, broken down in timed increments. Shots are color-coded by team, and readers can hover over a shot to reveal additional details (including the "expected goal value" calculated using a variety of shot quality indicators). Readers can enjoy an automated "walkthrough" of the data by scrolling down the page or can choose to explore freely by skipping to the Explore Yourself option at the bottom of the page. Amsterdam-based engineer and designer Vignesh Shenoy created the piece for his blog Shape of the Game, "a collection of data-driven, interactive explorations." As of this write-up, only one other post is featured on his site, "Kohli's path to 10,000 ODI runs, charted," which dissects the cricketer's impressive career. [EMB]

Comment on or rate this resource

Tech Tools

Back to Top
OpenShot
Science

OpenShot is an open source cross-platform video editor. It supports many dozens of video, audio, and image formats. Users can combine multiple video sources with an unlimited number of tracks and layers. The editor also allows for individual clips to be scaled, re-sized, trimmed, rotated, or cut as they are incorporated into a project. Static image overlays and watermarks can be added to the resulting video. A variety of 2D and 3D transition effects are available, allowing OpenShot users to blend clips together. Detailed usage instructions, including a Quick Tutorial, can be located in the User Guide (found under the Support menu on the OpenShot website). In the Videos section (also under the Features menu) readers can access video tours of the latest features in the software. OpenShot is available for Windows, macOS, and Linux computers. OpenShot is free software, distributed under the GNU General Public License, with source code available on GitHub. [CRH]

Comment on or rate this resource

Zim
Science

Zim is a desktop knowledge management application structured (or unstructured) similarly to web-based wiki software. Users enter data in a wiki-like markup that is stored internally in plain text files. Individual pages are placed into a folder structure that can be viewed either as a tree or an outline. To create new pages, simply add a link that directs to a page that does not yet exist. Additional features like equation formatting, task list management, and change tracking can be added using plugins. Readers will find detailed Zim usage instructions, including a brief Getting Started guide, linked on the Manual page. The Download page contains installers for Windows and Ubuntu Linux. Most other Linux distributions and all the major BSDs include Zim in their package management systems. MacOS users can install Zim using macports or nixpkgs. Zim is free software, distributed under the GNU General Public License, with source code available on GitHub. [CRH]

Comment on or rate this resource

Revisited

Back to Top
The Complete History of the NFL
Social studies

One of FiveThirtyEight's many projects, "The Complete History of the NFL," a data visualization project featured in the 02-01-2019 Scout Report (and updated in February 2020), provides a fun way to see how your home team has ranked over time.

Fans of American football may appreciate FiveThirtyEight's interactive visualization of NFL history. This project graphs the performance of every current NFL team over time (as well as many teams that no longer exist) to create a visual assessment of each team's strength relative to the rest of the league. Visitors can select their favorite team and view its graph alone, or they can choose to compare it to another NFL team. They can also zoom in to examine the graph in greater detail, and hovering over the graph displays the details of individual games with championships marked by yellow circles. Several highlights are chosen and briefly explained below the graph, including the San Francisco 49ers's strength in the 1980s and 90s and the Dallas Cowboys' resurgence in the 1990s. To quantify and compare the teams' performances across the years, FiveThirtyEight uses the Elo method, which it describes as "a simple measure of strength based on game-by-game results," to calculate ratings for every game in NFL history. This project was designed by visual journalist Reuben Fischer-Baum, with its statistical model by Nate Silver and additional contributions by Jay Boice and Matthew Conlen. The project was last updated in February of this year.

Comment on or rate this resource

PHPList msgid: 
813