The Scout Report -- Volume 25, Number 4

The Scout Report -- Volume 25, Number 4
January 25, 2019
Volume 25, Number 4

General Interest

Theme: Data Visualization

Revisited

In the News

If you would like to make a tax-deductible contribution to support The Scout Report and the work of Internet Scout, please visit our donation page.

General Interest

Back to Top
Young Minds Inspired
Educational Technology

Educators of a variety of disciplines and levels may want to check out Young Minds Inspired (YMI). Describing itself as "the nation's leading provider of free educational outreach programs for learners of all ages," YMI offers a wide range of lesson plans and classroom activities. Most YMI resources are created with elementary, middle, or high school students in mind, but it also provides material appropriate for preschool or college students. Visitors can browse lesson plans by broad categories such as language arts, STEM skills, or outside the classroom, and each resource thumbnail is labeled to indicate its intended audience. Many YMI resources, which are "produced in partnership with corporations, associations, and other organizations," are designed to accompany popular culture films, Broadway musicals, and novels, while others serve as educational PSAs on topics like energy conservation and the importance of vaccinations. YMI programs are developed by curriculum experts and reviewed by active teachers to ensure academic quality and educational value. Launched in 1978, YMI is led by Dr. Dominic Kinsley as its Editor in Chief and by Donald J. Lay as its Director of Outreach. [JDC]

Comment on or rate this resource

The Paris Review: Feminize Your Canon
Language Arts

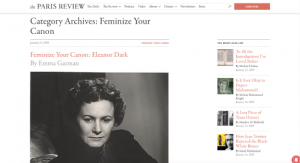
For those curious to expand their reading by learning about authors whose works were unjustly overlooked in their day, the famous literary magazine The Paris Review has something that may be just the thing. "Feminize Your Canon," the magazine's monthly column that launched in June 2018, "explores the lives of underrated and under-read female authors." The column opened with an examination of Olivia Manning, a twentieth-century British novelist who has been called "artistically ahead of her time" and wrote prolifically despite never quite achieving the success that she yearned for during her lifetime. Most recently, "Feminize Your Canon" turned its lens to Eleanor Dark, an Australian author whose "startling" and "challenging" 1934 novel Prelude to Christopher was hailed by critics in her native country and the UK, yet was refused publication in the US. Other authors discussed by this intriguing column include Anna Kavan, Kamala Markandaya, Violet Trefusis, and Rosario Castellanos. "Feminize Your Canon" is written by Emma Garman. [JDC]

Comment on or rate this resource

Greening with jobs - World Employment and Social Outlook 2018
Social studies

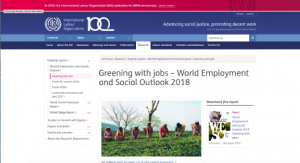
As the flagship report of the International Labour Organization (ILO), the World Employment and Social Outlook (WESO) uses evidence-based analysis to report annually on a different theme within the realm of global labor issues. Its most recent WESO report (published in May 2018) focuses on the impact that climate change and the world's response to it will likely have on global job markets. Their major findings? The ILO estimates that "if the right policies to promote a greener economy are put in place," the world will see a net increase of 24 million new jobs created globally, with 18 million of those resulting from achieving the Paris Agreement's goal of limiting warming to 2 degrees Celsius and an additional six million created by embracing a circular economy rather than a disposable one. It also points out that 1.2 billion jobs worldwide "depend on a stable and healthy environment." Here, in addition to the full 189-page report, readers will find an interactive presentation summarizing it, a two-minute video that briefly explains five highlights, and the ILO's press release. Founded in 1919 in the aftermath of World War One, the ILO is the first specialized agency of the United Nations. [JDC]

Comment on or rate this resource

The DAISY Consortium
Educational Technology

Established in 1996, the DAISY Consortium comprises an association of organizations around the world committed to "develop[ing] global solutions for accessible publishing and reading" in support of the consortium's vision that "people have equal access to information and knowledge regardless of disability." DAISY, which stands for Digital Accessible Information System, developed a set of audio accessibility standards which have been integrated into the broader EPUB 3 digital publishing standards, as well as several open source tools for creating accessible digital books. Here, visitors will find numerous resources for those interested in creating, learning about, or using audio-accessible ebooks and other digital publications. Teachers and librarians may want to check out the educators section, which features a collection of relevant resources such as guidelines, best practices, studies, and tutorials. Readers interested in DAISY's open source projects will find links to them on their homepage. For those unfamiliar with accessibility in digital publishing, the DAISYpedia may be a helpful starting point and can be found at the bottom of the homepage. In 2018, the DAISY Consortium was a finalist for a Digital Book World Award for Innovation in Accessibility. [JDC]

Comment on or rate this resource

Journal of Art Historiography
Arts

Supported by the Department of History of Art at the University of Birmingham (UK), The Journal of Art Historiography is an "open-access peer-reviewed e-journal...dedicated to the self-critical exploration of art history as a methodological practice." The website menu includes a guide that points out some themes that have been explored throughout the 19 issues of the journal since 2009. These themes include "global" art history; questioning the art historical paradigms; re-evaluating the scholars and their works; and collectors and consumers: the "other" figures in art history, to name a few. An interesting member of the last category is an article about conservators from issue 11, 2014, "How the west was won: Charles Muskavitch, James Roth, and the arrival of 'scientific' art conservation in the western United States," by Seth Adam Hindin. The website also includes submission guidelines for scholars wishing to contribute, as well as a listing of the internationally-based editorial board. [DS]

Comment on or rate this resource

Theme: Data Visualization

Back to Top
Kantar Information is Beautiful Awards 2018
Social studies

Data visualization has become an increasingly valuable way to explore and communicate information. Examples of "dataviz" abound in as many different styles as there are topics. One great place to look for recent work in this wide-ranging field is the Kantar Information is Beautiful Awards. These annual awards "celebrate excellence and beauty in data visualizations, infographics, interactives, and information art" and evaluate work on both "how well [it] suits the medium...[and] how well it illuminates the topic." In this interactive showcase, visitors can explore the 2018 winners, which are categorized by subject and include links to see each project in full. Here, readers can find work created by individuals as class assignments or side projects, such as Amy Cesal's DayDohViz in the unusual category, as well as work made by professional publication teams such as The Guardian and Bloomberg. Those interested can also view the shortlists, longlists, and winners from all previous years. The Kantar Information is Beautiful Awards were founded in 2012 by data visualizer and journalist at Information is Beautiful David McCandless, in collaboration with Aziz Cami, then the creative director of the market research group Kantar. [JDC]

Comment on or rate this resource

Refugee Flow
Social studies

Refugee Flow is an interactive data visualization project that "examines one of the direct fundamental causes of the global refugee crisis, the collapse of order and stability in today's international landscape." On the main screen, featuring a striking 3D globe, visitors can explore the locations and fatality counts of armed conflicts worldwide for the years 2010-2018 (as of this write-up), with the ability to filter by region and quarter. This screen also provides a graph of total asylum applications from the region and year being viewed. Under the project's route tab, visitors will find mapped representations of migrants' causes of death and injury along regional migration routes, accompanied by text and graphs summarizing each region's refugee situation, country-specific information on illegal border crossings, and links to data sources. This ongoing project integrates data from multiple sources, including the UNHCR Population Statistics Database and Armed Conflict Location & Event Data, to visualize "the impact conflict, persecution, and violence has on the lives of persons in their home countries and communities." Launched in July 2018, Refugee Flow was co-created by Will Su, a graduate student at Parsons School of Design, and Abin Abraham, a Web Development Coordinator at the United Nations Global Compact. [JDC]

Comment on or rate this resource

The Atlas of Economic Complexity
Social studies

From Harvard University's Center for International Development (CID) comes the Atlas of Economic Complexity. This long-running data visualization project "allows people to explore global trade flows across markets, track these dynamics over time, and discover new growth opportunities for every country." Intended for use by a broad audience, the atlas was originally launched as an online companion to the 2011 book The Atlas of Economic Complexity, and since then it has been updated repeatedly with new features, data, and visualizations. Visitors may like to start with the explore section, where they can enter search phrases such as "What did Colombia export in 2016?" or use on-screen filters to choose a combination of data to view in several different visualization options. Those interested in using the atlas for research should peruse the publications section to see examples of others' research using this resource, while the learn section contains key concepts and a forthcoming tutorial series. Developed and updated by a team of web developers, data visualizers, and research fellows overseen by Annie White, the Atlas of Economic Complexity is a product of CID's Growth Lab, which is directed by Professor of the Practice of Economic Development Ricardo Hausmann. [JDC]

Comment on or rate this resource

Tableau: Data visualization beginner's guide
Educational Technology

For readers who are interested in using data visualization but are uncertain of how to get started, this short beginner's guide by the data visualization platform Tableau (whose free product was featured in the 11-17-2017 Scout Report) offers a good jumping-off point. In concise and approachable language, Tableau begins by explaining the importance and value of effective data visualization from both a communication and career perspective, characterizing it as "a delicate balancing act between form and function." The article includes links to resources for numerous examples of data visualization in action, both as contemporary web-based models and as historical paper-based graphics drawn by hand. It also includes a list of visualization types to indicate the wide variety of available possibilities. Perhaps most helpful is the article's final section, which discusses ways to learn more about creating data visualizations. Here, readers will find links to Tableau's recommended learning resources, including their favorite data visualization blogs, books on theory and practice, and free training videos offered by Tableau. The platform also notes that "good data visualization theory and skills will transcend specific tools and products." [JDC]

Comment on or rate this resource

Seeing Data
Social studies

Seeing Data describes itself as "a group of research projects which aim to understand the place of data visualisations in society." By navigating via the menu on the left, both academic and general audiences will find resources to further their understanding of this topic. Those interested in how the public responds to and engages with data visualizations should check out Original Seeing Data Research, which addresses how the Seeing Data project conducted its initial research into these questions and includes a lengthy list of journal publications, blog posts, and other outputs from this research. The three current doctoral research projects that followed Seeing Data's opening project are summarized in the section entitled Relating to Data Through Visualisation. General audiences may like to start with Developing Visualisation Literacy, which "aims to help people make sense of data visualisations." Here, readers will find seven readily digestible mini-modules that give a basic overview of how to understand visualizations the public may encounter in news reports or online. Institutions and organizations associated with Seeing Data include the Universities of Sheffield, Leeds, and York in the UK, and the University of Agder in Norway. [JDC]

Comment on or rate this resource

Revisited

Back to Top
Open Course Library
Educational Technology

We originally featured the Open Course Library in the 1-19-2017 Scout Report and it continues to be an excellent source of teaching materials for instructors in a variety of disciplines.

From the Washington State Board of Community and Technical Colleges comes the Open Course Library, an extensive collection of courses and course materials (such as syllabi, classroom handouts, readings, multimedia resources, and assignments) for use by college-level students and instructors. As the authors of this website emphasize, these materials are not intended to replace classroom instruction; rather, these materials are made available in order to provide affordable classroom materials for students and resources for faculty members to consider integrating into existing courses. A central stated goal of the Open Course Library is to reduce costs to students. All courses included here can be taught without a textbook or utilize textbooks that cost $30 or less. As of this write-up, the Open Course Library features over 80 courses, including courses in English composition, symbolic logic, mathematics, and foreign languages. All course materials can be easily accessed as Google Docs.

Comment on or rate this resource

In the News

Back to Top
Researchers 'Hack' Photosynthesis to Improve Plant Efficiency

Scientists Have 'Hacked Photosynthesis' In Search Of More Productive Crops
https://www.npr.org/sections/thesalt/2019/01/03/681941779/scientists-have-hacked-photosynthesis-in-search-of-more-productive-crops

Plants botch photosynthesis 20% of the time. Fixing that could change agriculture
https://qz.com/1519141/scientists-have-found-a-way-to-help-plants-photosynthesize-better/

Fixing photosynthesis by engineering it to recycle a toxic mistake
https://arstechnica.com/science/2019/01/re-engineering-photosynthesis-gives-plants-a-40-growth-boost/

Synthetic glycolate metabolism pathways stimulate crop growth and productivity in the field
http://science.sciencemag.org/content/363/6422/eaat9077

Realizing Increased Photosynthetic Efficiency (RIPE)
https://ripe.illinois.edu/

Lesson plan: Modeling Photosynthesis and Cellular Respiration
https://www.calacademy.org/educators/lesson-plans/modelling-photosynthesis-and-cellular-respiration

Through photosynthesis, plants are able to pull carbon dioxide from the atmosphere and convert it into sugars for energy, helpfully releasing breathable oxygen as a byproduct. However, the enzyme most plants use in this process, a molecule known as RuBisCo, mistakes oxygen for carbon dioxide about 20 percent of the time, accidentally creating a toxic compound that plants subsequently have to detoxify through photorespiration, reducing their growth efficiency. New research may have developed a solution to this. In early January 2019, a team of scientists in an international research group called Realizing Increased Photosynthetic Efficiency (RIPE), based at the University of Illinois, published a scientific paper detailing how they had successfully used genetic engineering on experimental tobacco plants, enabling them to use a more efficient "shortcut" in their photosynthesis process. This shortcut fixes the RuBisCo enzyme's weakness and thus allows the tobacco plants to grow approximately 40 percent larger than unmodified ones. The implications of this increased efficiency are potentially huge, particularly for agricultural food crops like soybeans and cowpeas, and it is there that the researchers are focusing next. [JDC]

At the first three links, readers will find recent news articles explaining the study and its implications. The first article, written by Dan Charles for NPR, also includes a three-minute radio segment on the story. The second article, written by Zoe Schlanger for Quartz, includes with its explanations multiple photographs of the researchers' test subjects. For those interested in a slightly more in-depth explanation, Ars Technica provides this in the third article, written by science editor and former biological researcher John Timmer. At the fourth link, readers will find the researchers' full academic article published in the journal Science. Curious to learn more about RIPE's work and other research projects? Follow the fifth link to the research group's official website. Finally, educators who would like to introduce this story into their classrooms may be interested in the sixth link, where they will find a hands-on lesson plan on photosynthesis and respiration created for students in grades 5-10. This standards-aligned lesson plan, which comes from the California Academy of Sciences, includes three sets of learning expectations and core ideas to accommodate the different grade levels.