The Scout Report -- Volume 26, Number 12

The Scout Report -- Volume 26, Number 12
April 3, 2020
Volume 26, Number 12

General Interest

Theme: Census Day

Tech Tools

Revisited

If you would like to make a tax-deductible contribution to support The Scout Report and the work of Internet Scout, please visit our donation page.

General Interest

Back to Top
Science Learning Hub
Science

Launched as a part of the New Zealand Government's Science in Society Plan, Science Learning Hub bridges the gap between students, teachers, and scientists by curating thousands of resources that "demonstrate how the stories of science can be used to enrich school teaching and learning, making it more relevant, engaging, and meaningful." The website's landing page highlights trending topics and events, as well as featured articles and activities. The remainder of the site offers resources of interest to a variety of audiences. Educators may want to explore the Teacher PLD (professional learning and development) section, which features webinars, planning, and pedagogy to assist science teachers both in their professional advancement and their classrooms. The Citizen Science section collects resources for those interested in volunteering to "contribute to scientific projects, usually by collecting or analysing data." On the Explore Topics and Explore Concepts pages, readers will find information covering subjects from "reptiles and amphibians" to "science and society." These subjects can be sorted alphabetically or by popularity. After clicking on a topic or concept of interest, users will be led to a collection of related materials, which may include articles, videos, and activities. In the top right corner of each sub-page, visitors will find an "Explore+" button, which highlights similar topics and concepts. Readers with a particular subject in mind can also search by clicking the magnifying glass in the top right corner to open a query bar. [EMB]

Comment on or rate this resource

Colorism in High Fashion
Social studies

"Colorism in High Fashion" is a long-form essay by data scientist and software engineer Malaika Handa that examines 19 years of Vogue magazine covers (from 2000 to 2018) to try to determine how the publication represents women of all skin colors. Users can view a visual representation of the 262 female cover models by skin tone across the years, or filter by individual models to see when they appeared on Vogue's cover. One large takeaway is the pattern of increased variation after 2005. However, this increase appears to be due to the four times that actress and model Lupita Nyong'o appeared on Vogue's cover between 2012 and 2018. With this observation in mind, the article goes on to examine tokenism and points out that the magazine has employed "exactly one black photographer in 125 years of publication." The conclusion? Since Vogue first featured a black cover model in the 1970s, "ethnic diversity and representation is improving?[but] Vogue (and the entire fashion industry) can do better." [DS]

Comment on or rate this resource

Language of Place: Hopi Place Names, Poetry, Traditional Dance and Song
Social studies

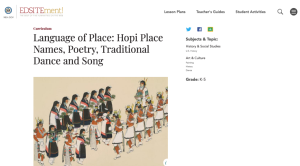
Educators or mentors of students in grades K-5 interested in high-quality, free teaching material for their social studies or humanities curriculum may enjoy "Language of Place: Hopi Place Names, Poetry, Traditional Dance and Song" from EDSITEment! (featured in the 07-15-2011 Scout Report). This three-part lesson plan pairs primary sources from the Hopi Tribe, "a sovereign nation inhabiting over 1.5 million acres in northeastern Arizona," with creative activities that ask students to apply what they learn about the "language of place" to their own experience. In Lesson One students dig deeper into the meaning of Hopi names for places using maps of the Hopi homeland and then examine the meaning behind place names in their home communities by creating personal maps. In the second lesson, students build on their knowledge of the language of place to "examine literal and figurative language used in Hopi poetry." Finally, Lesson Three focuses on the way traditional songs and dance highlight the key role of the environment in Hopi culture. Each lesson plan includes suggested assessment and extension activities and lists the specific Common Core State Standards satisfied by its contents. [SMH]

Comment on or rate this resource

Planet Puffin
Science

Coined "Summer 2019's hottest puffin podcast," Planet Puffin promises listeners an experience that is "silly, serious, scientific, cultural," and (above all else) "all things puffin." The podcast is produced by BBC Radio and follows journalists Emily Knight and Becky Ripley as they venture off the east coast of Scotland to an island that is home to "tens of thousands of seabirds." The pair spends their summer chronicling the adventures of the island's Scottish puffin colony, searching for answers to questions ranging from "What is the secret to their [the puffins] long and happy marriages?" to "How are they coping with climate change?" The series is divided into a dozen episodes, which are short and sweet ? usually between ten and twenty minutes. On the site, readers will find all of the episodes, as well as additional resources such as "Thirteen proper puffin facts" and "The ultimate puffin quiz." Episodes are available at the link above and on popular streaming services such as Apple Podcasts and Spotify. [EMB]

Comment on or rate this resource

The Diary of Samuel Pepys
Social studies

Transport yourself to 17th-century London with The Diary of Samuel Pepys, a daily diary kept by "increasingly-important" civil servant Samuel Pepys from 1660 to 1670, where he writes about everything from his business meetings to his wife's beauty and going out to the theatre. Readers looking for a brief overview may wish to begin with the Summary of Pepys's diary under The Diary tab, before browsing the full text of Pepys's diary by date (under All Entries). There is also a Letters section containing correspondances to and from Peyps. Readers can learn more about Pepys's world with the In-depth Articles on topics like "The Garden at the Navy Office." After exploring for a while, users may find that familiar people, places, and events regularly crop up. To better understand these, look to The Encyclopedia, a reference point for "5,077 people, places and things," from Peyps's time, offering contextual significance and history. The Encyclopedia also includes the Pepys family tree and a Map with markers denoting places mentioned in Pepys's diary. The site is run by Phil Gyford, a web designer and actor, with help from Project Gutenberg where the full text of Peyps's diary was sourced. [AL]

Comment on or rate this resource

Theme: Census Day

Back to Top
U.S. Census Knowledge Quiz
Social studies

What role do postal carriers play in census preparations? What new response category will be featured on this year's census form? Test your Census expertise on these questions and more with the Pew Research Center's U.S. Census Knowledge Quiz. The 12-question quiz covers the history, purpose, and changes to the U.S. Census and provides test-takers with answers and explanations immediately following their attempt. Readers who are displeased with their results may want to sign up for the Pew Research Center's "short email mini course" on the U.S. Census (accessible by clicking the linked text on the quiz's landing page). This free course is divided into five sections including "What is the census and why is it taken?" and "What is new ? and possibly challenging ? about the 2020 census?" The course is taught by D'Vera Cohn, a journalist who has studied the topic for over two decades. Enrolled users will receive "an email with a lesson every few days," allowing for a manageable way to better understand why this data collection process is so important. [EMB]

Comment on or rate this resource

Census Reporter
Social studies

Whether you are a journalist in search of reliable data or a layperson interested in exploring findings from the U.S. Census and American Community Survey, Census Reporter may be for you. Funded by Knight News Challenge, this resource seeks to "make it easier for journalists to write stories using information from the U.S. Census bureau." The site features two search bars, inviting users to search by location or topic. Topics are also available categorically under the Topics header. Under this header, readers may want to begin on the Getting Started and About the Census pages, which provide a brief overview on the U.S. Census Bureau's "data collection programs." After this introduction, visitors can navigate data on themes such as Families, Income, and Geography. If you do not find a topic you are looking for, the site embeds a feedback link and welcomes ideas for new information to be added. Those looking for further inspiration may want to browse the Examples section near the bottom of the page (under "Using this site"), which demonstrates how the site's data can be turned into useful charts and visuals. [EMB]

Comment on or rate this resource

Black Census Project
Social studies

Recognizing that "a traditional probabilistic survey sample?often fails to fully represent populations whose experiences are important to understanding the complexity of Black life," Black Futures Lab (an organization committed to "building Black political power" at all levels) launched the Black Census Project in 2018. Using both online surveys and in-person outreach, the project has since become "the largest survey of Black people conducted in the United States since Reconstruction." Its findings highlight key issues of concern to black communities, including criminal justice, affordable housing, and economic insecurity. The project "intentionally oversampled certain populations?enabling the Census to include communities that are often left out," and breaks down these finding into three reports: More Black than Blue: Politics and Power in the 2019 Black Census, When the Rainbow is Not Enough: LGB+ Voices in the 2019 Census, and Beyond Kings and Queens: Gender and Politics in the 2019 Black Census. Readers can download all these reports on the site, each of which is approximately 20 pages. [EMB]

Comment on or rate this resource

Census Historical Timeline
Social studies

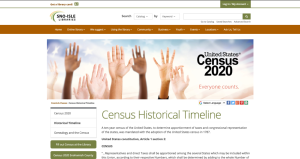
On August 2, 1790, the United States conducted its first census, pursuant to Article I, Section 2 of the United States Constitution. In the 230 years since, many changes have been made to the census ? from its schedule to its counting process to its questions. Sno-Isle Libraries's Census Historical Timeline chronicles many of these changes and key events in U.S. Census history. The timeline is broken down by decade (to correspond with each census taken between 1790 and 2010), and the sections include links to the United States Census Bureau's historical archives, which provide a more in-depth look at each time period. Highlights include 1850, when the names of all members of a household were recorded (rather than just the head of household); 1960, when census questionnaires were first delivered to people through the mail; and 1990, when "extensive public television, radio, and print advertising" promoted the importance of the census. On the left-hand side of the page, readers will find additional census information, including a 2020 Census "Questionnaire Sample" (available in English and Spanish). [EMB]

Comment on or rate this resource

United States Census Bureau

Readers who want to investigate past Census Data should look no further than the United States Census Bureau, "the leading source of quality data about the nation's people and economy." On the Explore Census Data portal, users can find relevant data by conducting a basic search on the main search bar or clicking "Advanced Search" (located just under the bar) to search with additional filters. For example, a basic search for "poverty guidelines" reveals that in 2018 about 13.1 percent of individuals in the United States were living below the poverty line (according to 2018 American Community Survey results). Scrolling down the main page, visitors will find a Questions section that may be helpful to troubleshoot any issues. Below that, there are sections for Tables, Data Profiles, Maps and Visualizations, and Industry and NAICS codes. By clicking the "View Tables" button, users can toggle through Tables, Maps, and Pages tabs. On the Tables tab, readers will find a variety of pre-sorted data charts and also have the option of building out a new chart by clicking the "Customize Table" button in the top-right corner. The Maps tab features a State Selection Map, an interactive tool that lets users click on a state to pull up a state-specific data profile. Each state's page includes interesting statistics such as the total population, median household income, and poverty and employment rates. Finally, the Pages tab houses publications such as data "QuickFacts" sheets. Data can also be sorted by clicking the "View Profiles" and "Explore Microdata" buttons found near the bottom of the Census Bureau website's homepage. [EMB]

Comment on or rate this resource

Tech Tools

Back to Top
Kate
Science

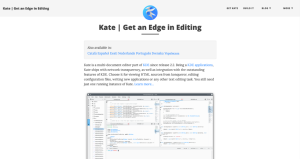
Kate is an advanced text editor that uses a multiple document interface. The editing window can be split into multiple panes. Within each pane, multiple documents can be opened in tabs. Kate includes bidirectional text support, a bookmark system, and on-the-fly spell checking. For programmers, Kate provides syntax highlighting, code folding, bracket matching, and code autocompletion for a number of programming languages. Users can save sets of documents as editing "sessions" that can be opened again as a group. Kate's plugin system allows for panels to be added to interact with a shell prompt, SQL database servers, and debuggers. Other plugins provide additional features such as XML validation and code snippet libraries. Kate is free software distributed under the GNU Lesser General Public License, with source code available under the Build It section of the website. Under the Get Kate tab, readers can find installers for windows and macOS systems. Users of Linux and BSD systems will find Kate in their system's package manager. [CRH]

Comment on or rate this resource

OpenSimulator
Science

OpenSimulator is server software that can be used to create multi-user interactive 3D virtual environments. These environments are similar to what "online virtual world" game Second Life provides, but the OpenSimluator developers state that "OpenSimluator does not aim to become a clone of the second life server platform. Rather, the project aims to enable innovative feature development for virtual environments." Developers can extend OpenSimulator with new functionality by writing modules in C#. OpenSimulator environments can be linked together using the Hypergrid protocol, such that users can move between them. Readers can locate a list of public OpenSimulator instances via the Grid List tab. Instructions for connecting to an instance can be found under Connecting. In the Download section of the site, users will find installers and setup instructions for both Linux and Windows systems, as well as source code and links to the OpenSimulator Git repository. [CRH]

Comment on or rate this resource

Revisited

Back to Top
Powers of Ten: Census Edition
Social studies

Readers looking for "an interactive atlas of Census data" may enjoy Powers of Ten: Census Edition, a visual data project last featured in the 04-27-2018 issue of the Scout Report.

Powers of Ten: Census Edition is a data visualization project by Jia Zhang that allows viewers to explore U.S. Census data in a novel way. The project was inspired by the Ray and Charles Eames's two films Powers of Ten, which was released in 1968 (the "sketch" version) and 1977 (the "final" version). The Eames's film depicts a couple picnicking in Chicago. The camera then zooms out, depicting the couple from a distance ten times farther away every ten seconds, eventually revealing satellite images of Earth and, eventually, a diagram of space. Similarly, Zhang's visualization allows visitors to explore population statistics and demographic data of an increasingly larger portion of the United States. The map begins in a single neighborhood, or, census block group. From here, visitors view an entire census tract and, next, a census county. As visitors are presented with these larger geographical areas, the population figures on the screen are updated, and new demographic statistics are introduced. As visitors reload the homepage, different starting locations are presented. When visitors allow the site to access their location, they may see their own neighborhood. Visitors interested in learning more about how Zhang created this map can check out the About section.

Comment on or rate this resource